Maps can be as useful to the historian as other documents, and can show features which are not recorded elsewhere, but need to be interpreted carefully. The quality of the map depends on the skills of the surveyor, and its content depended on what he had been asked to show. The cost of producing a map, and the space constraints imposed by the scale, usually resulted in the omission of all detail that was considered unnecessary. Before reading a map, it is therefore important to try to understand who made it and why, and to remember that just because something was not shown, it does not mean that it did not exist. Christopher Saxton’s map of Leicestershire and Warwickshire published in 1576, for example, shows towns, villages, rivers, hills and woodland, but no roads other than Watling Street. The omission may have been partly aesthetic, as the addition of roads would make his maps seem cluttered unless other information was omitted. Moreover, few people made long journeys to places they did not know, and those who did might find knowledge of rivers and areas of dense woodland more useful, as these presented barriers and risks to the traveller. Itineraries of town and village names could then be produced, and as regular stops would have to be made for the horses, there would be ample opportunity to ask the way to the next place on the list. In a period when many ‘roads’ were little more than tracks, with diversions during adverse weather or floods, up-to-date local guidance was important. Of greater perceived interest than the roads appears to have been the location of parks, status symbols of their owners, the potential purchasers of his atlas, which are indicated on the map by their pales.
County maps
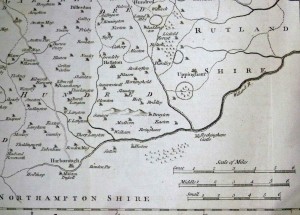
It is not known exactly how Saxton produced his county maps, but it was probably by a combination of surveying and observation from vantage points such as hills and church towers. The project was financed by Thomas Seckford, a prominent member of Elizabeth I’s government, and had the support of William Cecil (later Lord Burghley) and the Queen herself. The maps were engraved on copper plates, so numerous copies could be (and were) created. They formed the basis of many later maps, and also became key components of the new genre of county histories. Leicestershire’s first county historian, William Burton, added a number of villages to Saxton’s map as well as the main road (now the A6) from Market Harborough through Leicester and Loughbough to the northern border of the county, had his revised version engraved, and included it within his Description of Leicestershire, published in 1622. The other features were not changed; there was still no indication of the shape of settlements or the size of each place, other than the use of a different symbol and larger non-italic script for places with markets, and the park pales still dominated the western part of the map. As the statute mile of 1,760 yards (introduced in 1593) was not yet fully accepted, he included scales for the great, middle and small miles.
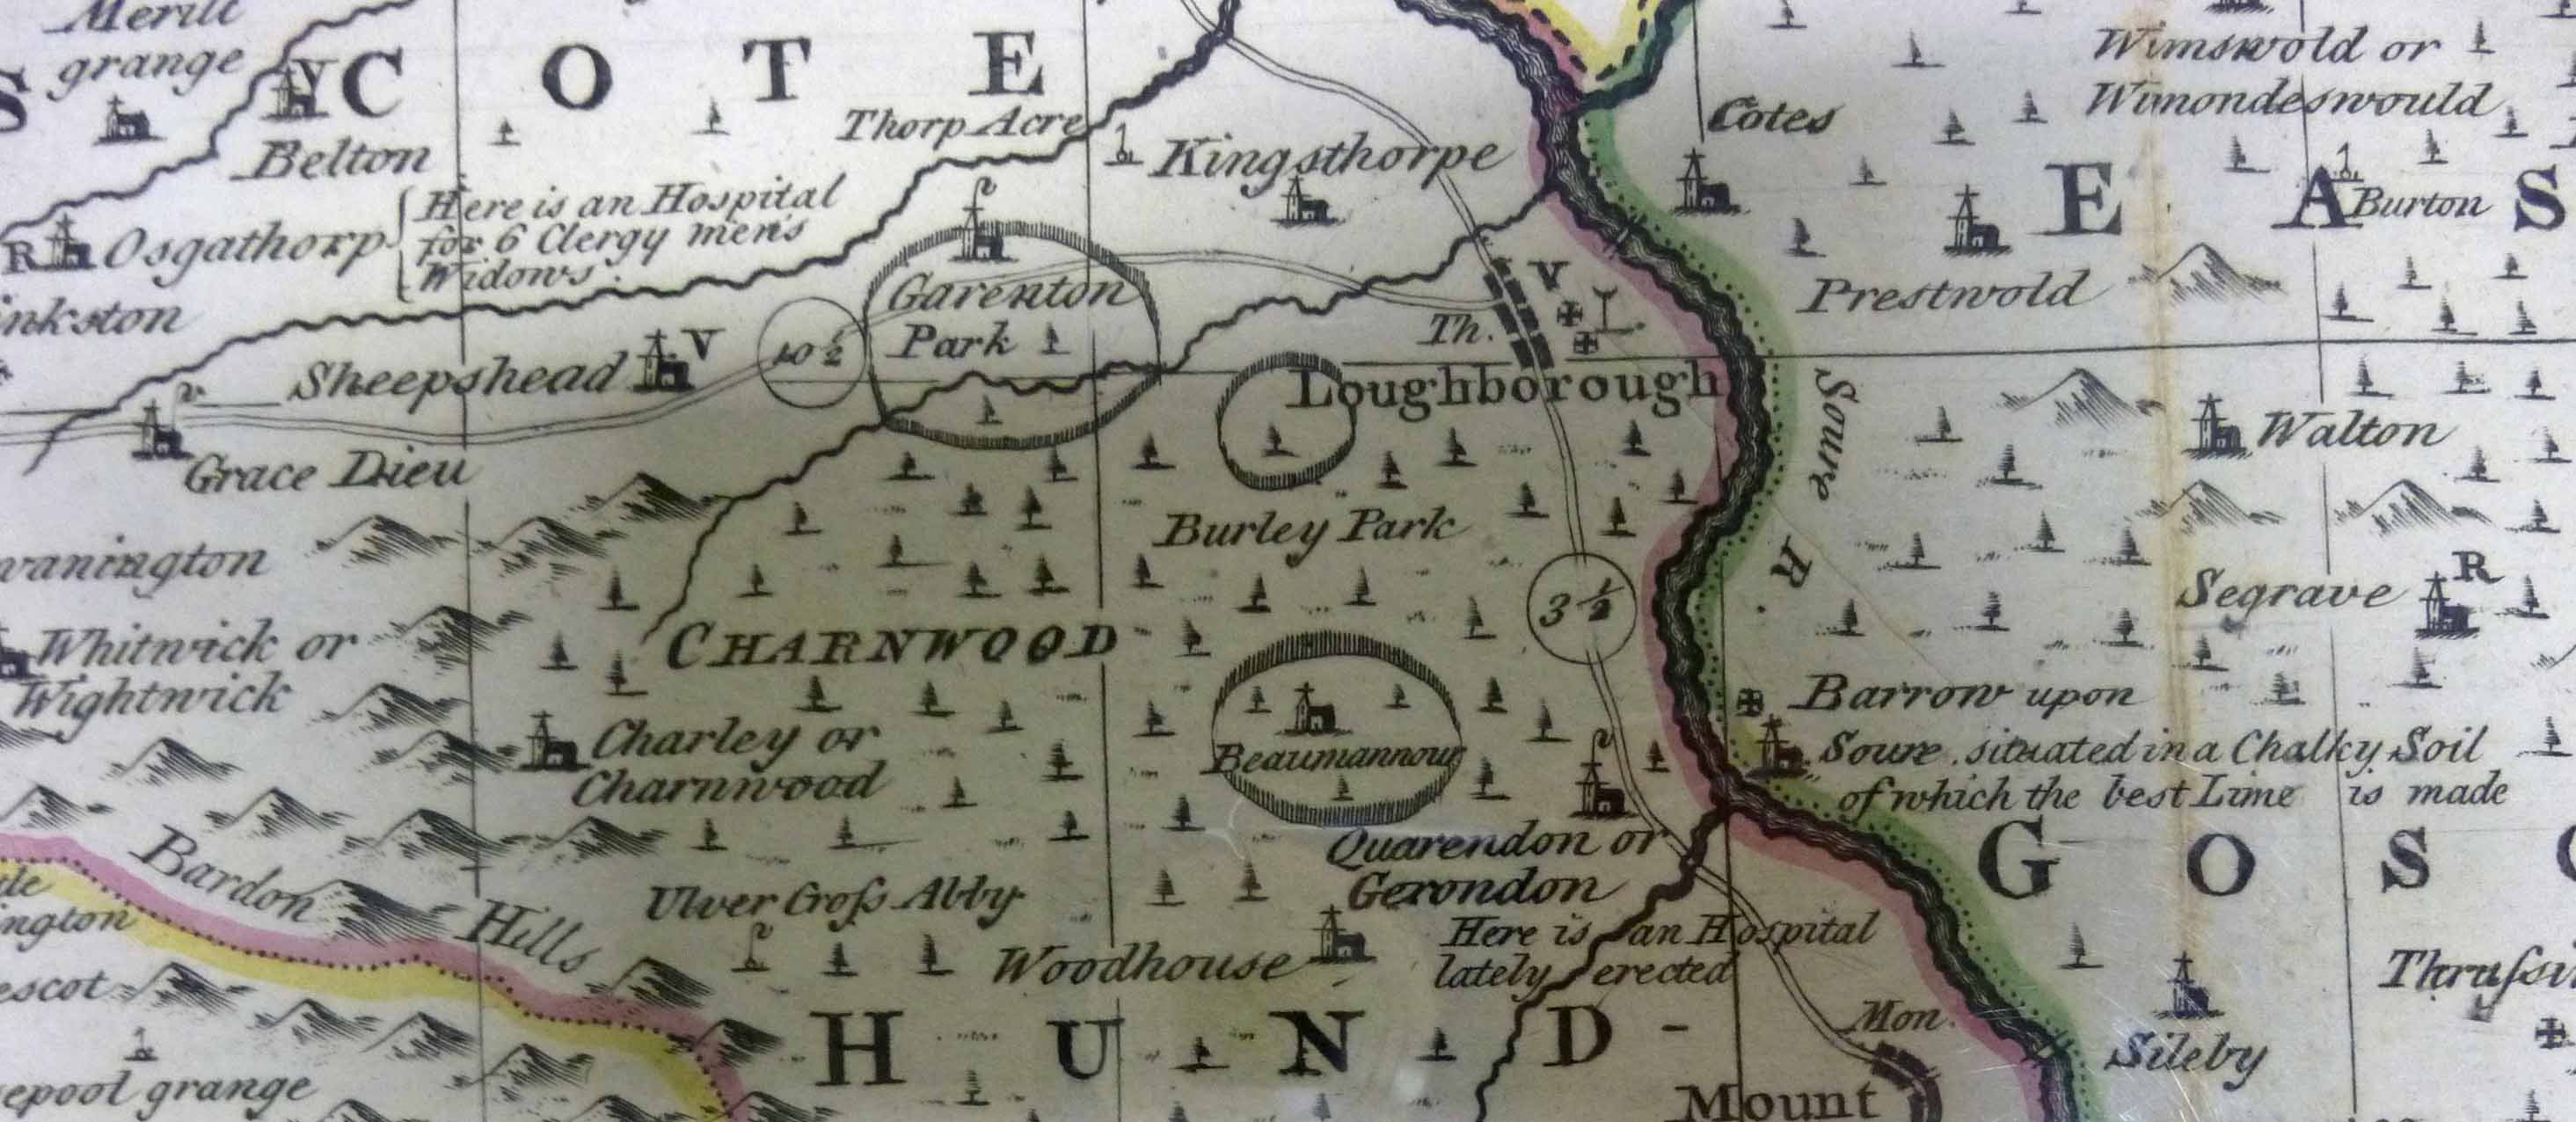
Many others produced maps based on Saxton’s survey. Although they are not always attributed to him, they can be readily identified by the shape of the county, and in particular its north-eastern vale, where Bottesford is shown to be at about the same latitude as Hemington. Two worthy of mention are John Speed’s map of 1611, which includes a plan of the town of Leicester, and Emmanuel Bowen’s map of 1756. Part map and part pictorial county history, Bowen included a considerable number of roads and also noted towns with their market days and distances between them, post stages, ancient religious houses, ‘modern charity schools’, distinguished between rectories and vicarages and filled the space between the county boundary and the margins of the page with information about the county and its history.
By the second half of the eighteenth century the sophistication, accuracy and availability of scientific instruments had grown and private schools were beginning to teach surveying techniques. Encouraged by cash prizes offered intermittently by the Society of Arts for new and accurate county surveys, larger-scale maps were produced for almost every English county. The prize-winners included local clergyman and schoolmaster John Prior, whose 1777 map of Leicestershire was surveyed by his former pupil Joseph Whyman. Produced in the midst of the greatest period of landscape change since the establishment of nucleated settlements around 1,000 years earlier, Prior’s map is of immense value to the local historian, and not just for its greater scientific accuracy. Its scale of one inch to the mile allowed more villages and far more detail to be shown. It includes new roads recently laid out by enclosure commissioners, older roads in parishes with early enclosures or which still had their open fields, turnpike roads and their tollbars, the county’s first canal, as well as windmills, watermills, churches and chapels, village settlement patterns and their relative sizes, country seats, isolated farmhouses, coal pits, lime works and even the pumping engines in the coal fields of north-west Leicestershire. Parish boundaries are not shown, but the hundred boundaries are marked. Like Speed’s map, it includes a plan of Leicester in the bottom left hand corner.
The pace of change in the countryside was accelerating, and older maps soon became out of date. Leicestershire was regularly re-mapped at county level over the 19th century to show new canals and especially the growth of the railway. However, many of these maps were at small scales and are of limited value to historians beyond the overview they give of the transformation of communications. For a more intimate knowledge of our towns and villages we instead need to turn to the larger scale and more details manuscript maps showing individual places rather than the whole county. The three main categories of these are estate maps, enclosure maps and tithe maps. Each was produced for a specific purpose, which needs to be understood to aid interpretation of their features and to understand what might not be shown, even if it existed on the ground.
Estate maps
The improvement in surveying techniques which occurred in the 16th century and gave rise to Saxton’s maps began on the continent, but was fostered on arrival in England by the transfer of several million acres of land owned by the religious houses before their dissolution initially to the crown and thence to private owners. Some of these new owners commissioned maps of their estates, to help them to get to know, to manage and to improve their land. Estate maps exist only for parishes which were part of a large estate, and may cover anything from one or several parishes to just a few acres, depending on why they were created. Estate maps dating back to the 16th century are rare, but maps from the 17th and especially the 18th centuries are more numerous. Some depict an enclosed landscape, while others show the village’s open fields, perhaps with some ancient enclosures around the edge of the parish. The amount of detail varies, depending on why the map was commissioned. The most useful estate maps for the historian can show the individual strips in the open fields, old enclosures, the pre-enclosure road layout, rivers and streams, wind and water mills, quarries, brickworks, the village stone pit, the size, shape and precise location of the village core and perhaps also the pinfold for stray animals, nonconformist chapels, any ancient earthworks or deserted villages and any landscaped parks or gardens. They often include large numbers of field and furlong names, some of which may provide clues to earlier land use. Property elevations may be included, although the sizes, styles and building materials shown may not always be accurate. A few are accompanied by written surveys, listing tenants and acreages. In short, they can allow an almost complete reconstruction of the landscape at one moment in time. When coupled with other surviving maps, or with other documentary sources such as court rolls, it may be possible to build a picture of the landscape history of that parish over a substantial period.
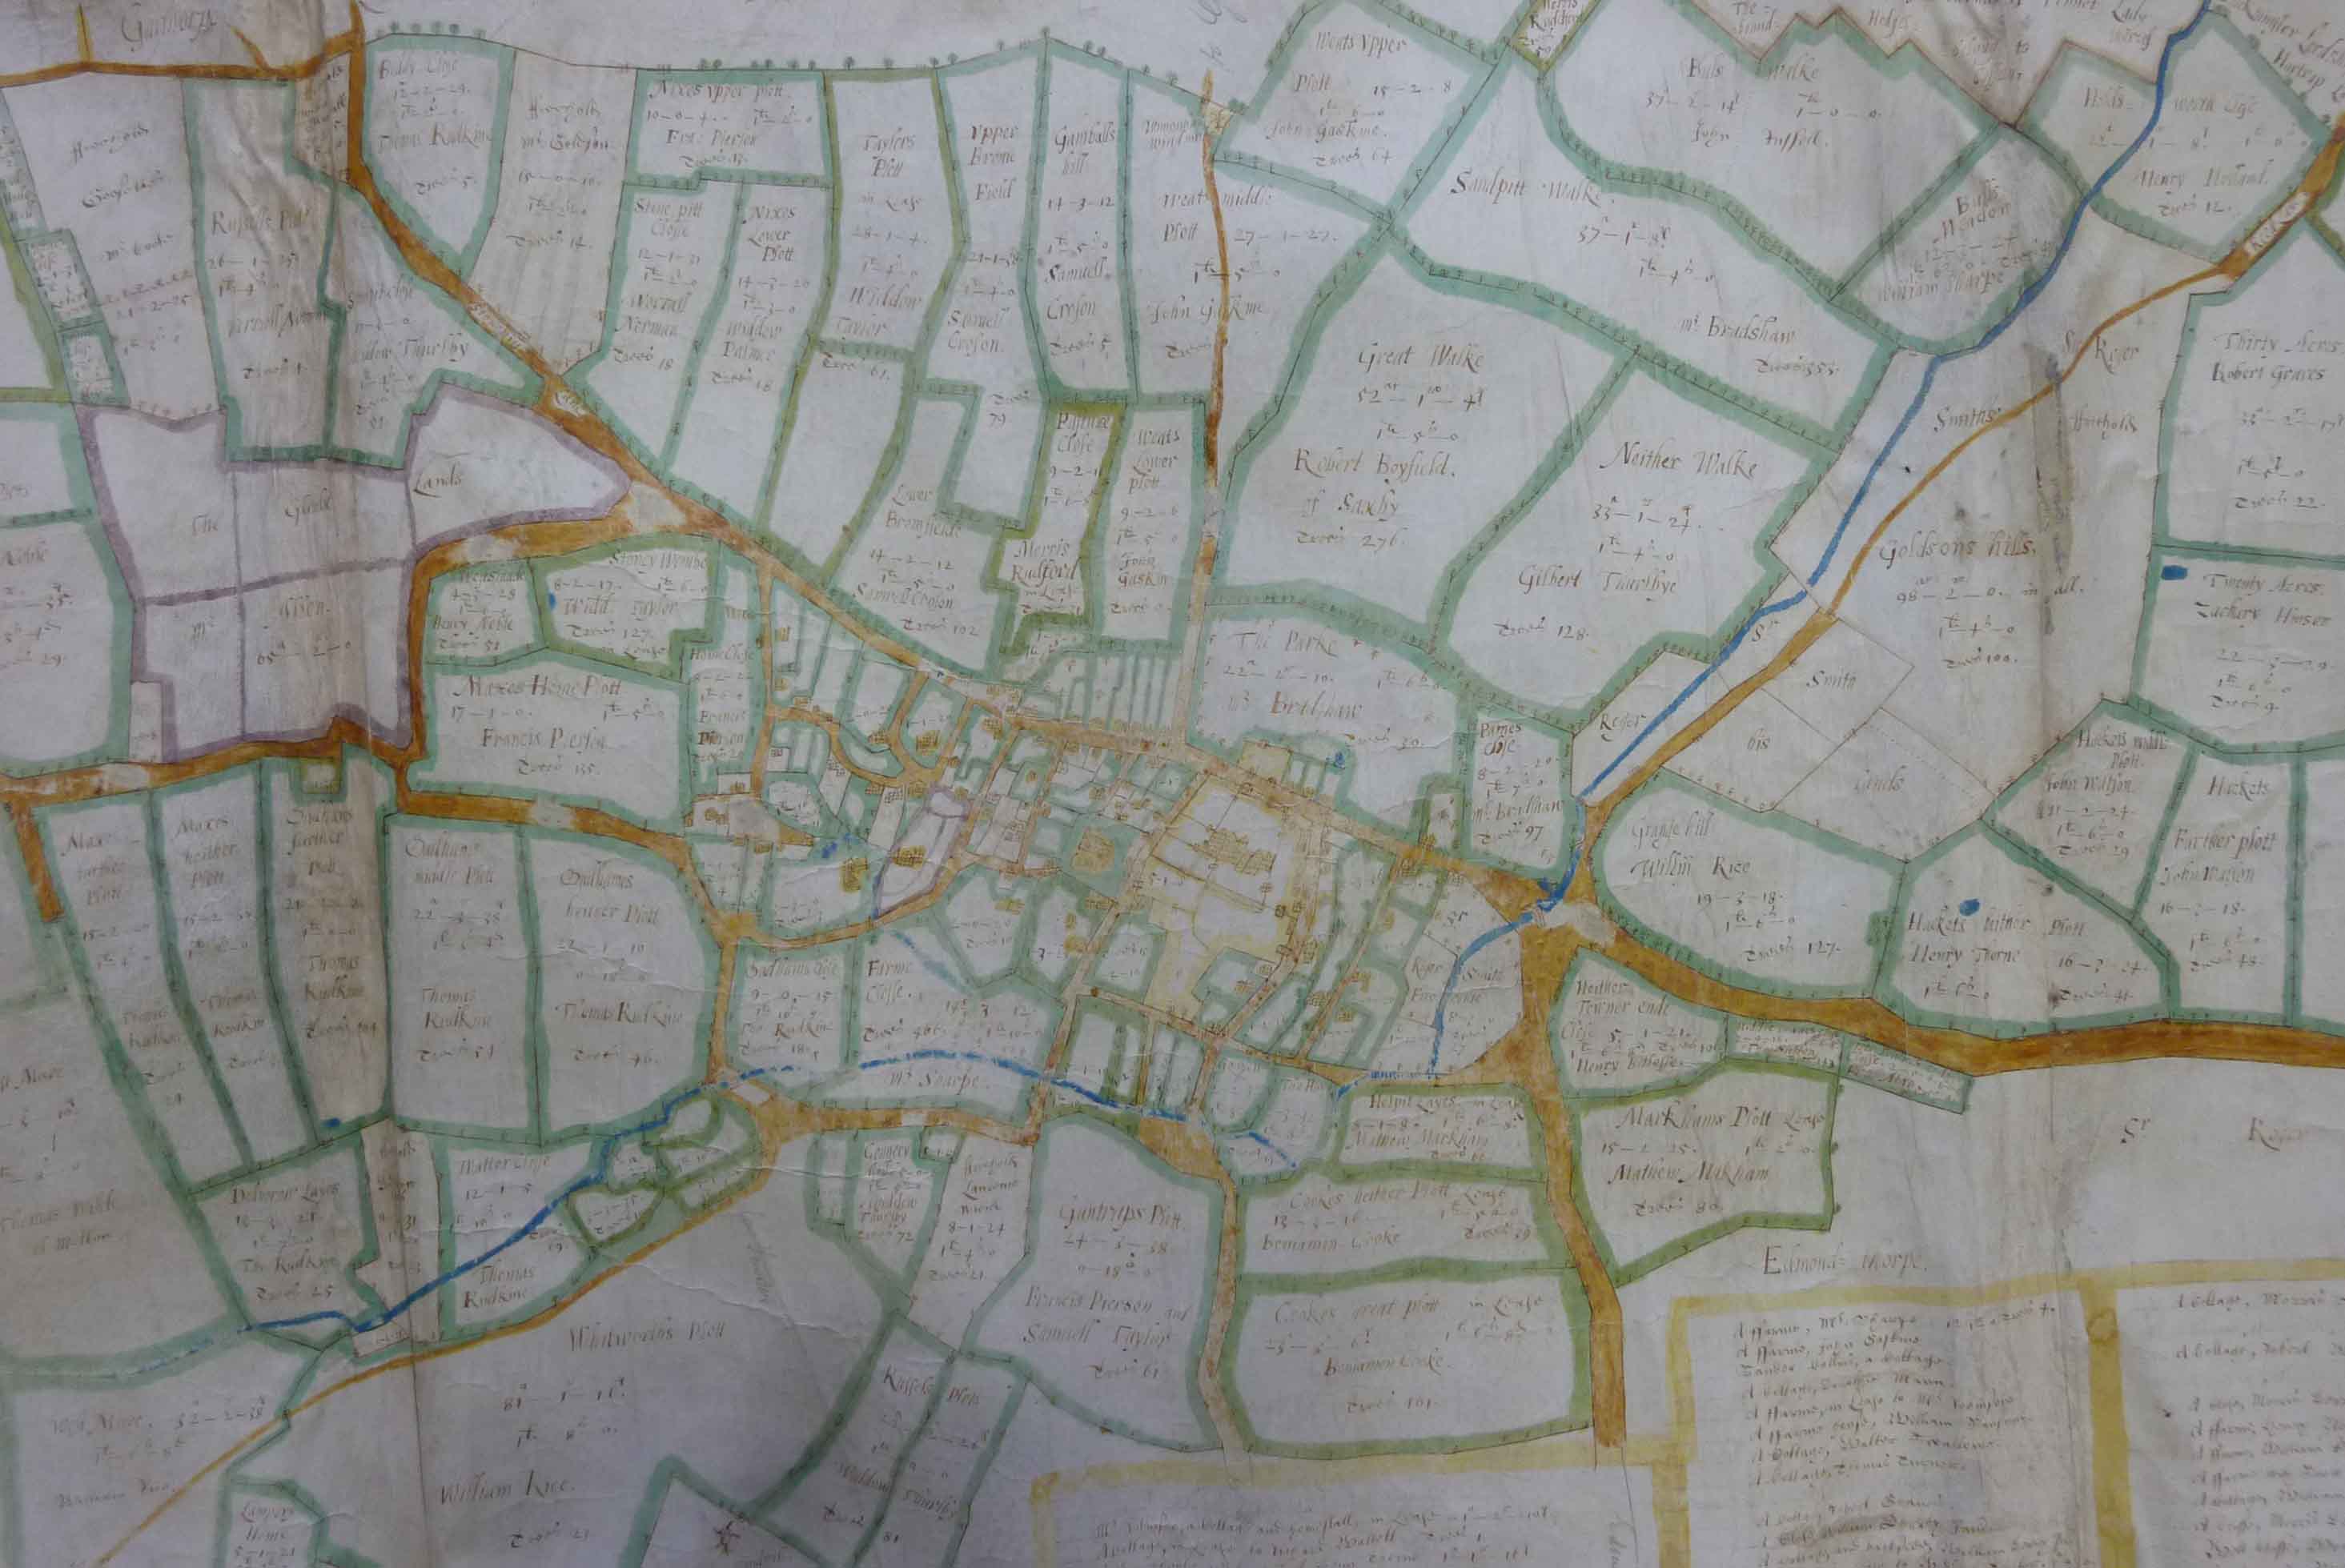
The quality of estate maps is variable, and depends on the abilities of the surveyor appointed, and how much the owner was willing to spend. Many ambiguities arising from a poor quality survey can be resolved through a comparison with later maps. Omissions from the area mapped are not uncommon, as an estate map rarely shows more than the land owned by the person who commissioned it, which may lie in separate parcels some distance apart. Identifying where surviving estate maps are held can pose a challenge. Many are with the estate papers of the landowning family who commissioned the map, or who bought the land at a later date. A large number of held at the Record Office for Leicestershire, Leicester and Rutland, but in estate maps produced for some families who owned land in many counties may be held many miles from the parish concerned. The national A2A catalogue may help.
Enclosure maps
Enclosure involved taking all or part of the communal open fields, or the ‘waste’ land beyond the fields, into private ownership and surrounding it by a fence or hedge to keep others out. It could be followed by the conversion of arable land into pasture. Only a very small number of the earliest enclosures were accompanied by a map, but from 1730 the usual method of enclosure in Leicestershire was by Act of Parliament, which often involved the creation of an enclosure map. A list of the 157 Leicestershire Enclosure Acts passed between the first in 1730 and the last in 1842 can be found in Volume II of the Victoria County History for Leicestershire (pp. 260-264), available in many county libraries and the Record Office for Leicestershire, Leicester and Rutland.

Each Enclosure Act appointed commissioners, who in turn appointed a surveyor to produce a map of the land to be inclosed. This could comprise a whole parish, or a substantial part of one. The map would be overlaid in due course with the proposed new roads, their status (public or private) and new allotments of land. Unfortunately, these working copies rarely survive. More common are the final enclosure maps, drawn up towards the end of the process to show only the new allotments of land, but these are still very helpful. The written enclosure award provides a key, as it details the allotments of land and also describes the new roads proposed with reference to their position in the unenclosed landscape. If the map and award are studied together it is often possible to reconstruct a pre-enclosure map of the parish, even if the surveyor’s working copy does not survive. This can then be refined from other documentary sources, and from the ridges and furrows of the medieval fields, which in Leicestershire have been mapped from aerial photographs of the county and published in the following books:
R.F. Hartley, The Medieval Earthworks of Central Leicestershire (Leicester, 1989)
R.F. Hartley, The Medieval Earthworks of North-East Leicestershire (Leicester, 1987)
R.F. Hartley, The Medieval Earthworks of North-West Leicestershire (Leicester, 1984)
R.F. Hartley, The Medieval Earthworks of South-West Leicestershire (Leicester, 1989)
Unfortunately, a significant proportion of Leicestershire parishes that were enclosed by Act of Parliament have no known surviving map, either because it was in private hands and remains so, has been lost, or perhaps because a final version was never produced. A final map would have added to the costs, and while the precision which they gave to individual landholdings minimised the possibility of later disputes, there was no legal requirement to produce one until 1801 (when most of Leicestershire had already been enclosed). A list of all the enclosure maps for England and Wales is included within:
R.J.P. Kain, J. Chapman and R.R. Oliver, The Enclosure Maps of England and Wales 1595–1918: A Cartographic Analysis and Electronic Catalogue (Cambridge, 2004).
Enclosure maps were usually proposals of what was intended, rather than surveys of what was achieved. In virtually every case the allotments of land would be followed through, for that was the fundamental purpose of the process, but the roads specified by the commissioners may not always have been constructed, or may have taken a different route, and any other proposed landscape changes, such as the diversion of streams, may not have been made. Enclosure maps should therefore be compared with the earliest Ordnance Survey maps for the same area, to see if the proposed works took place.
Tithe maps
Parishes which were not enclosed by Act of Parliament, or where land was enclosed after 1836, will usually have a tithe map. The tithe was one-tenth of the annual produce of the land and was originally paid to the church, although after the dissolution of the religious houses by Henry VIII some tithes became payable to lay people. Many tithes were extinguished when land was enclosed by a Parliamentary Act and Award, either through an allocation of land to the tithe owner(s) in lieu of future tithes, or by commuting them into a cash payment known as a ‘corn rent’, which fluctuated with the price of grain. Elsewhere, tithes continued to be paid, but from 1836 those tithes which were still paid in produce were converted into an annual (variable) cash sum under the terms of the Tithe Commutation Act. Tithe maps were one of three types of record created as a result of this Act, the others being apportionments, which are generally filed with the map and need to be read alongside it, and tithe files, which detail any debates, disputes and compulsory awards made where agreement between landowner and tithe owner could not be reached. (More information about tithes and their commutation can be found in the farming section of this website.) Tithe maps identify all the land that was liable to tithes. Accuracy was initially considered to be of utmost important, as the Act merely commuted tithes into a cash payment and did not extinguish them. The maps were intended to define precisely the boundaries of each portion of land to provide a permanent reference, in case any dispute arose in the future. However an amending Act of 1837 relaxed the degree of accuracy required.
Under the 1836 Act the country was divided into nearly 15,000 tithe districts, each generally either a single parish or a township (part of a parish). Maps of each tithe district were drawn up by local surveyors where tithes were still payable, and often provide the earliest known record of parish boundaries. Some of these maps show the whole tithe district, while others only show the land that was liable to tithes. The initial proposals required the maps to be on a scale of at least 4 chains to the inch (20 inches to the mile), and to include an up-to-date survey of each property boundary to an accuracy that could serve as evidence in court. Those produced to this standard are known as ‘first class’ maps. A greater number of districts (seven out of every eight) took advantage of the 1837 amending Act and produced maps that were either on a smaller scale or based on existing maps rather than a new survey. These vary widely in quality, from a rough sketch to a detailed survey.
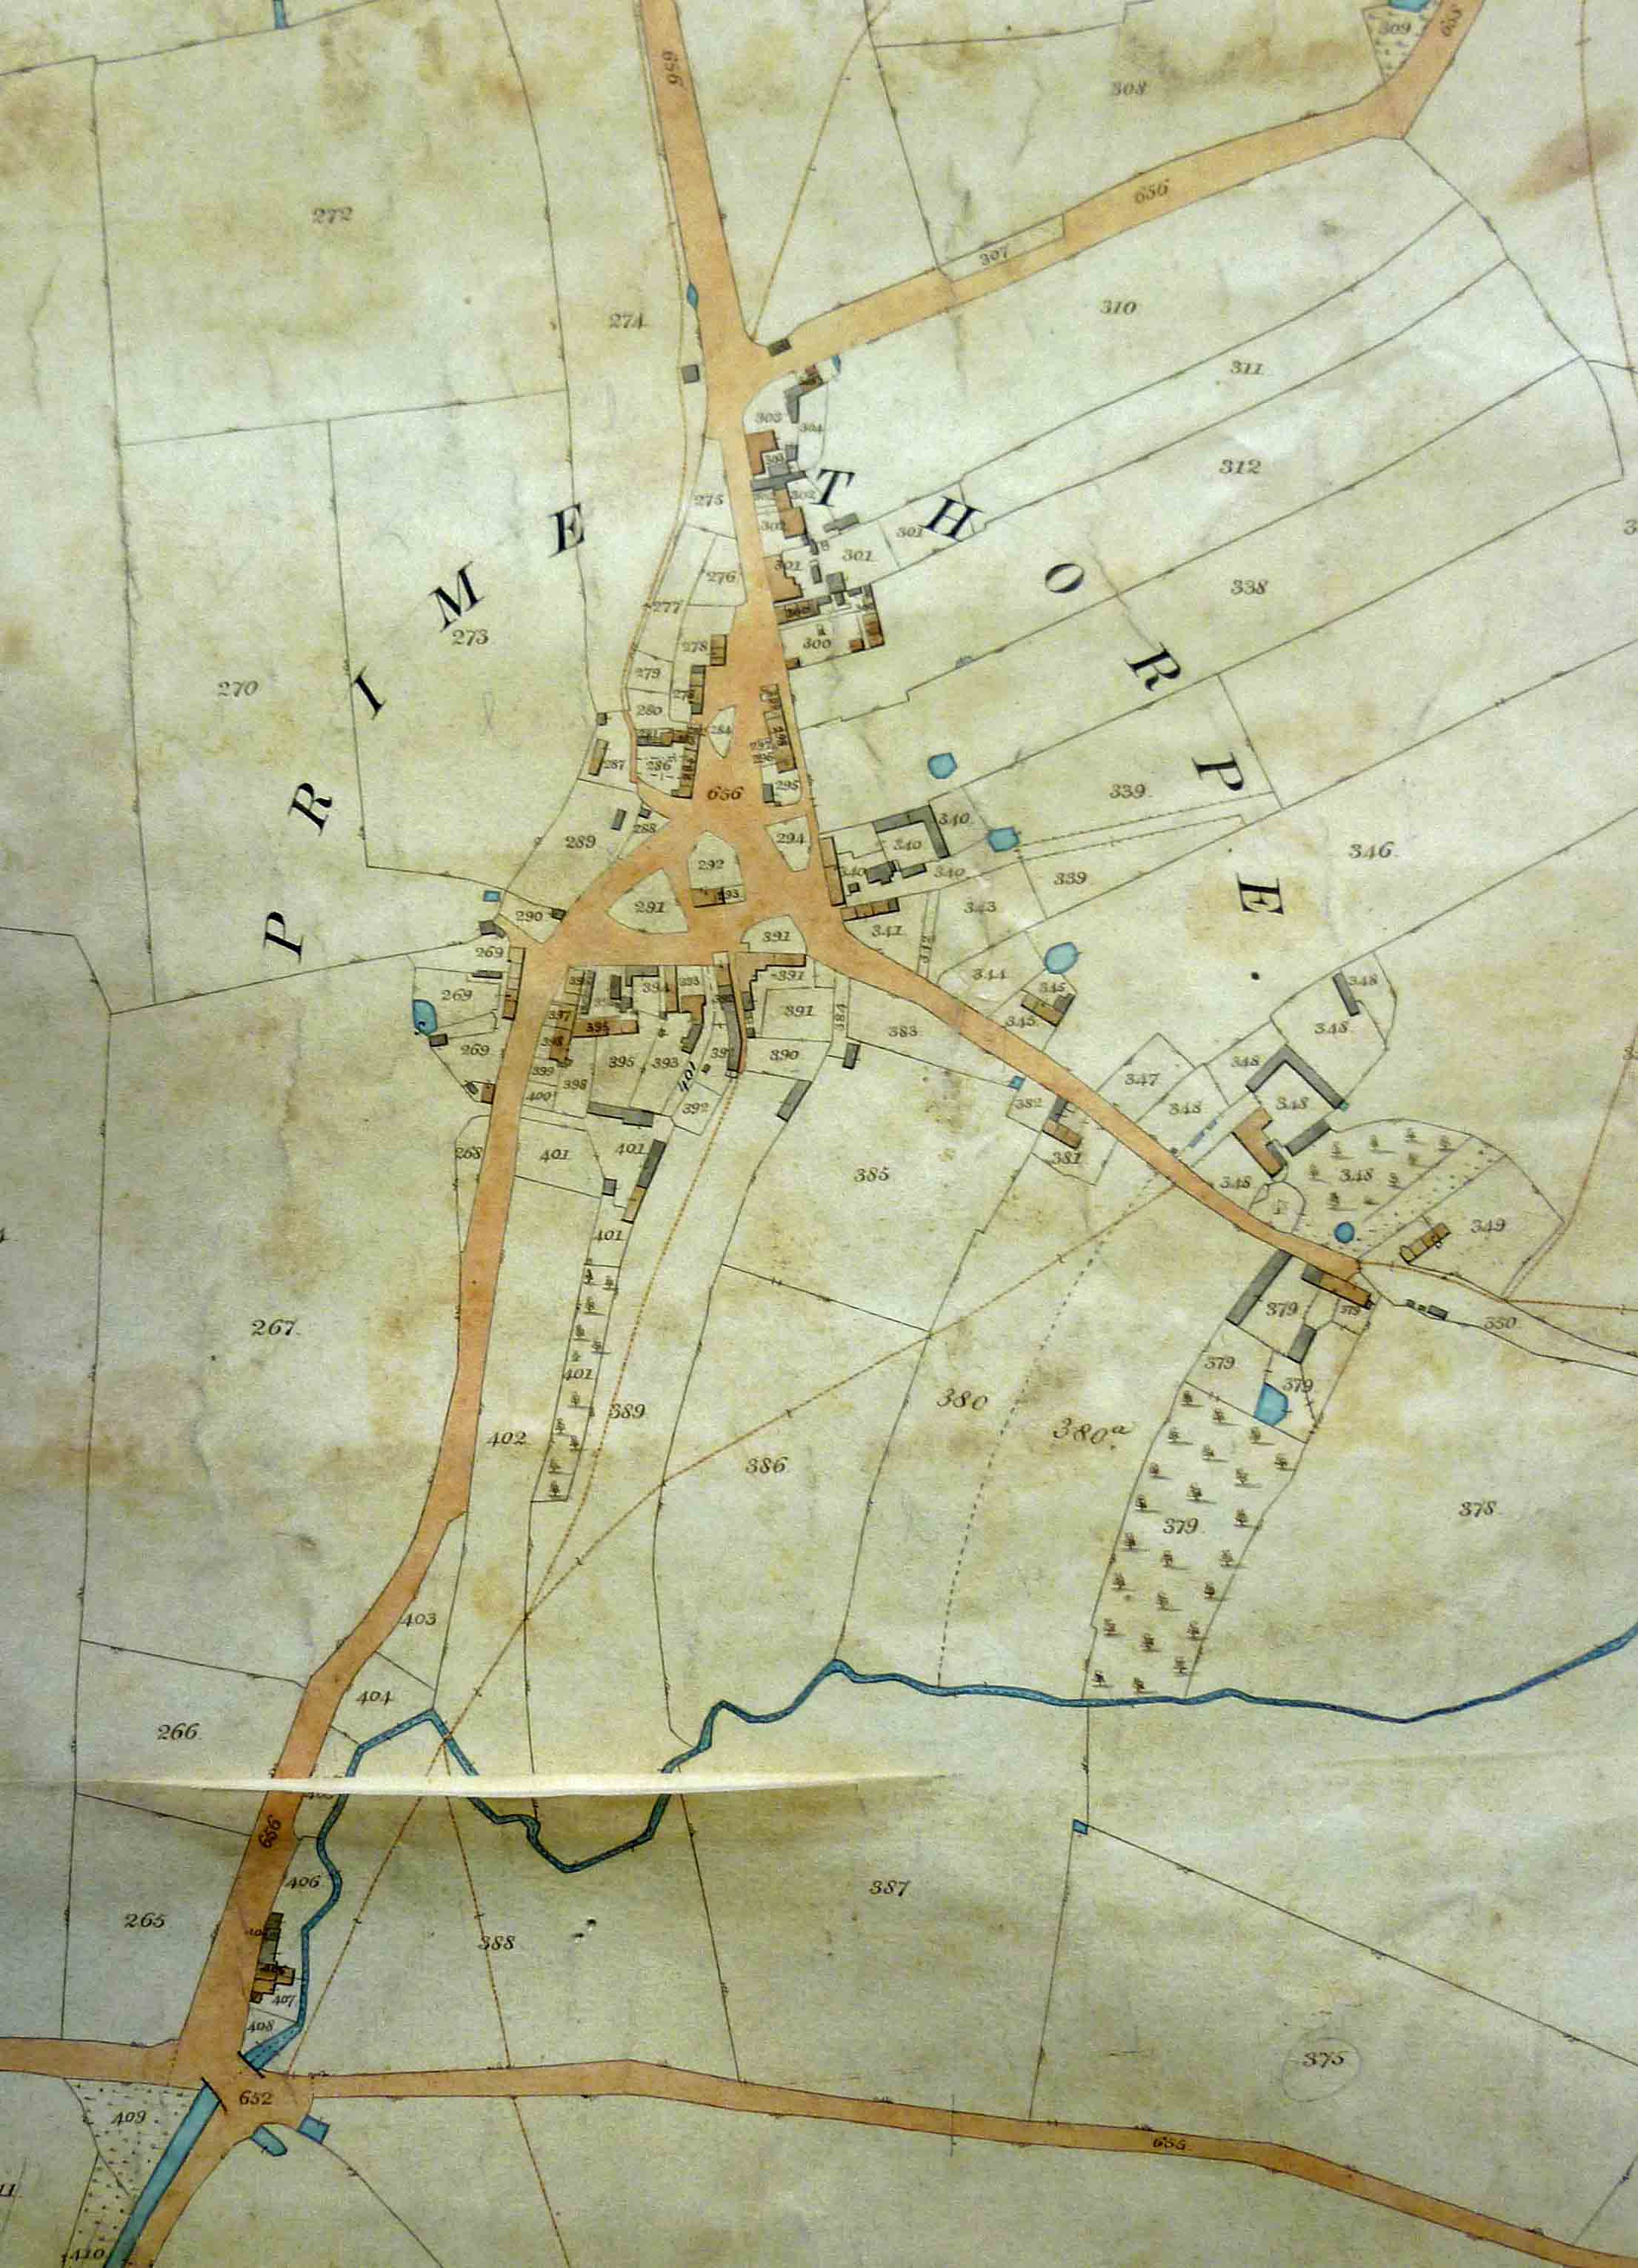
Tithe maps, especially those graded as ‘first class’, can provide a great deal of detail, not just fields, farmhouses, woodland, orchards and marshy ground, but also buildings with details of their use, such as a theatre in Ashby de la Zouch and nonconformist chapels, and industrial or commercial features, including a brickyard in Billesdon and a tollbar in Belton. They should be studied alongside the accompanying apportionment, which provides the key to the map. After an introductory section which can set out the reasons why tithe is not payable on certain lands within the parish, the main part will comprise a numbered schedule of the owners and occupiers of every field or close (which correspond to the numbers on the map), its area, the land use (arable, pasture, meadow, woodland, etc.) and the charge payable to the tithe owner(s) for that land (in £ or the equivalent in bushels of grain.
Three copies of the tithe map and apportionment may survive. One copy would usually have been provided to the parish or to the tithe owner, with a second copy to the diocese, and both of these copies may now have been deposited at the Record Office for Leicestershire, Leicester and Rutland (which has a separate card index for tithe maps). A further copy of each map was kept by the tithe commissioners and is now at The National Archives at Kew, although held offsite. The best guide to surviving tithe maps is:
R.J.P Kain and R.R. Oliver, The Tithe Maps of England and Wales (Cambridge, Cambridge University Press, 1995)
Arranged by county and parish, this book includes the date of the apportionment, the number of acres it covered, the date of the map, its scale, whether or not it met the requirements of a ‘first-class’ map, brief details of the features shown and the National Archives catalogue number.
Roads
The best known of the early road maps are the strip maps of John Ogilby, published as an atlas in 1675, which includes three routes through Leicestershire. That they were published in a large volume suggests they were intended to be consulted before travelling, but their focus is the road itself, the terrain and what the traveller would see when passing along the route. Bridges, major road junctions and towns that the road passes through are included, and this basic information is supplemented by the names of villages near the route (whose churches might be seen by the traveller), the location of mills, hills, occasional warnings of land that could flood and sometimes whether the fields lining the road were arable or permanent (enclosed) pasture. The maps were on the scale of one inch to mile. The resultant survey was then divided into short strips and arranged in columns, with the journey moving from bottom left to top right. This gave the map a more practical rectangular form, with each strip containing a compass rose which could rotate slightly between columns. The small number of routes covered by these maps and the selectivity of the features included limits their value to the historian, but the details of land use at this early date are valuable and aid understanding of the local economy, farming practices and early enclosure.
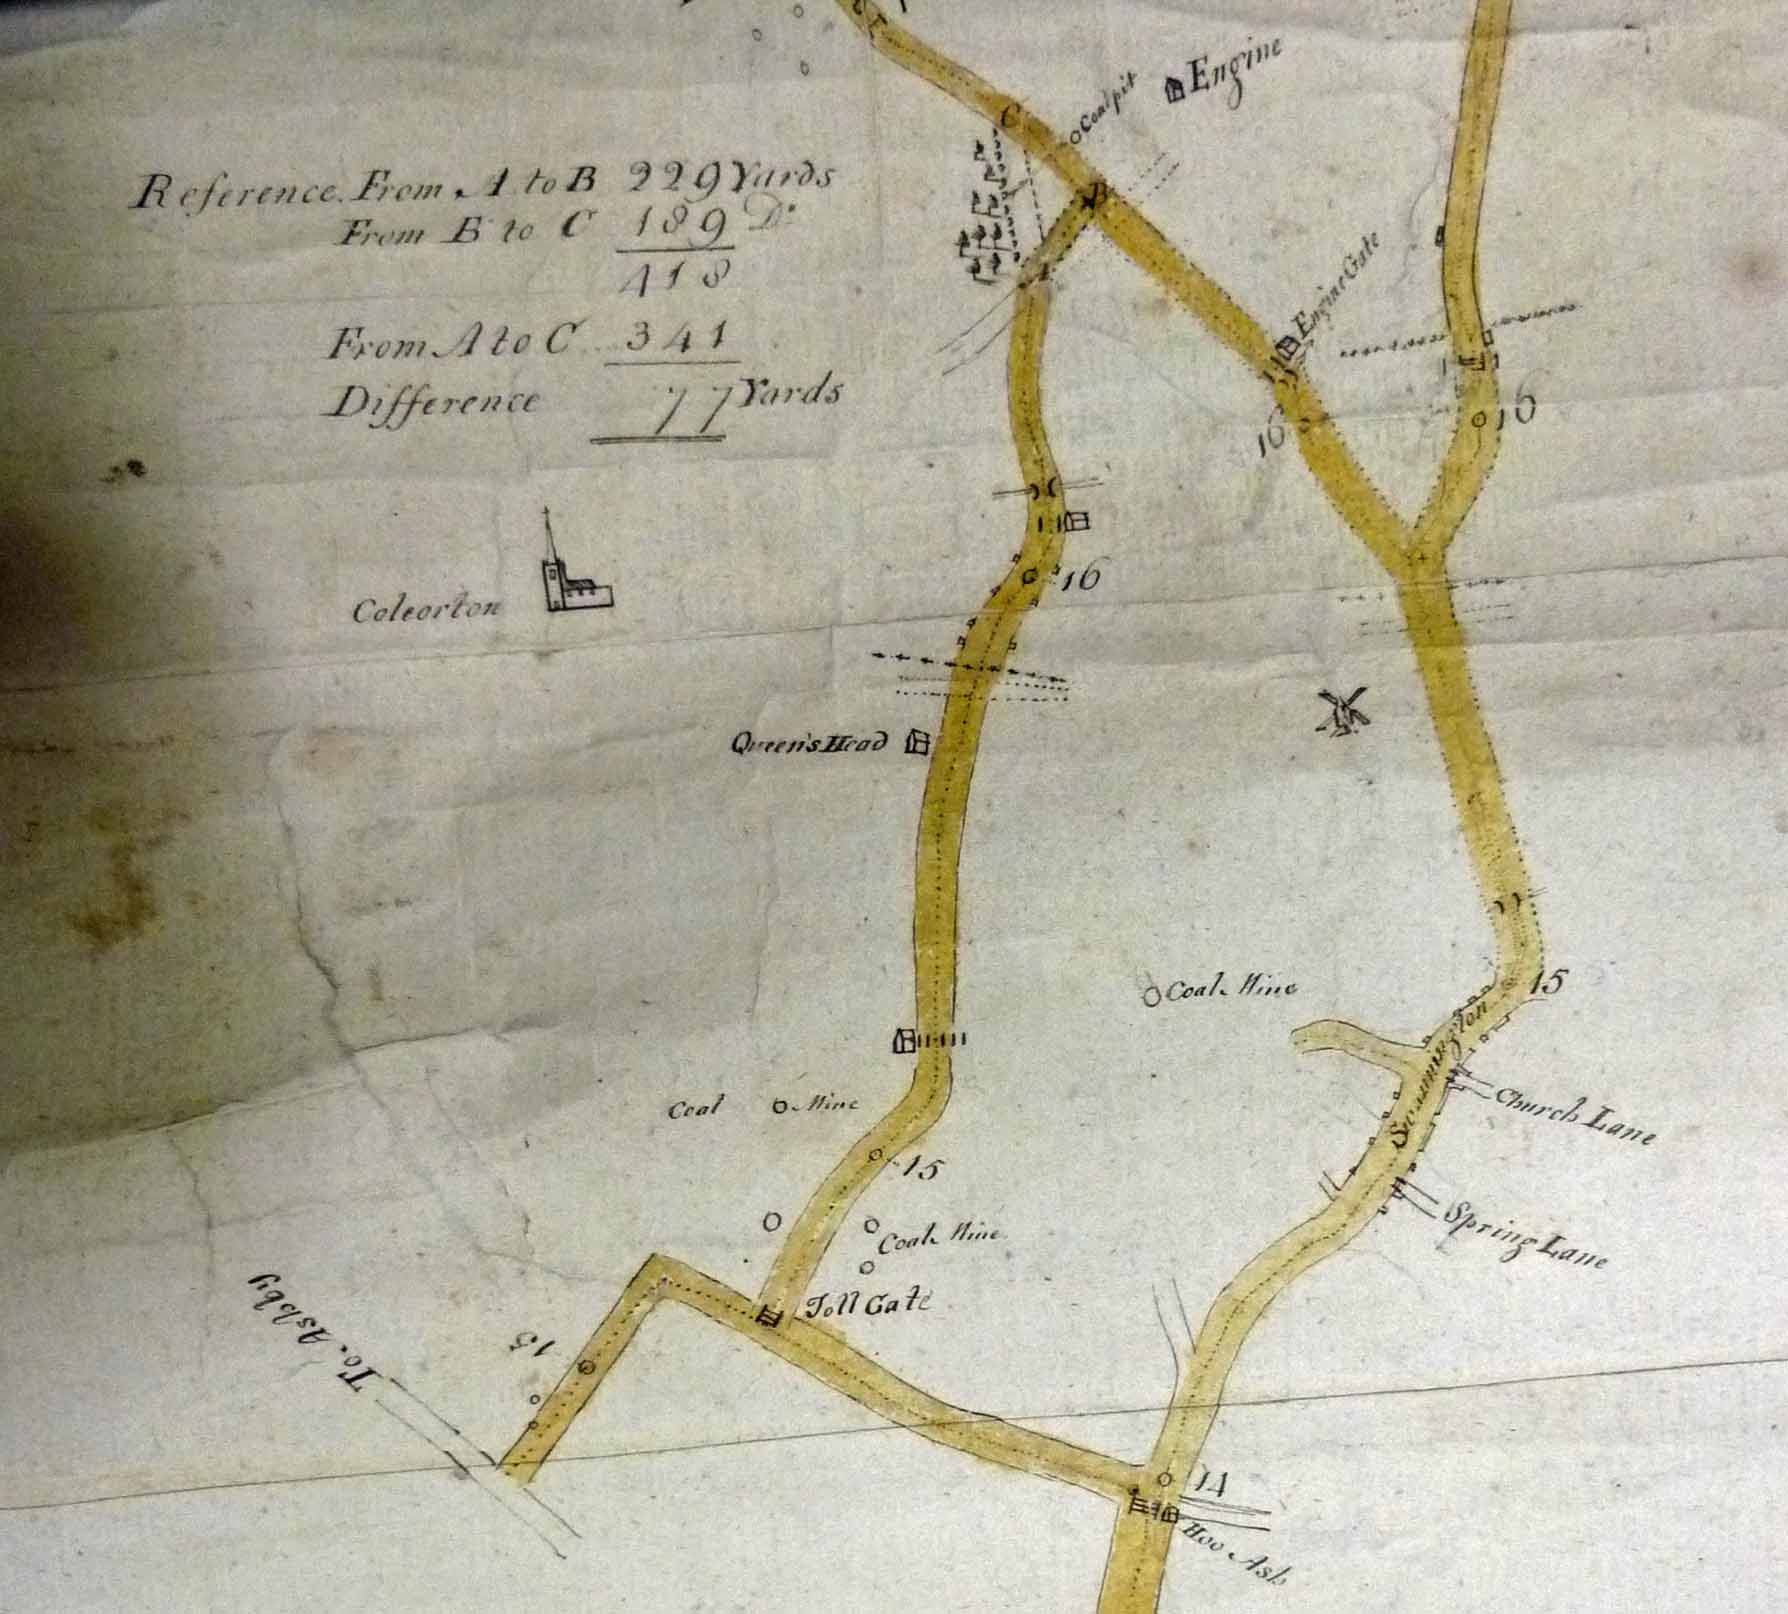
The best mapping of roads after Ogilby first comes within the large scale maps of the late 18th century, such as that of 1777 by John Prior, already mentioned. It is interesting to compare the roads he surveyed, mid-way through Leicestershire’s parliamentary enclosures, with those that exist today. Some roads which now link neighbouring villages do not appear to have existed in 1777, while others shown then are no longer roads, or have been diverted. Prior’s map distinguishes between turnpike roads (shown with solid lines) and others (indicated by broken lines). In respect of the turnpikes, their milestones and tollbars are also mapped, with the latter being very useful, as while there may be documentary evidence for their approximate location, it is not always obvious either from their names or from the road itself exactly where they stood.
The creation of turnpike trusts in Leicestershire from the 1720s gave rise to another type of map or plan. The trusts were local initiatives which took over the running of an existing stretch of road, and had to be approved by Parliament. The appointed trustees were given the power to collect tolls from travellers over a certain number of years, which would be used to pay for maintenance and to provide a return to their investors. A list of Leicestershire turnpikes can be found here.
From 1807 plans of all proposed new turnpikes and alterations to existing turnpikes had to be deposited with the county clerk of the peace, and the deposited plans for Leicestershire are now held by the Record Office for Leicestershire, Leicester and Rutland, and listed in their online catalogue. Each shows the proposed road, roads which crossed the turnpike and their destination, buildings, towns and villages along the way and sometimes also details of landowners or land use.
Canal and Railway plans
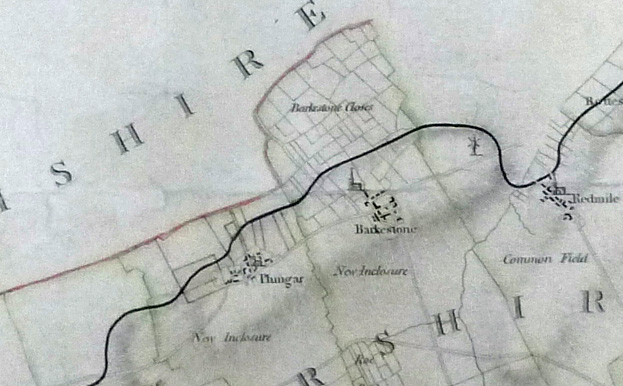
From 1794, when canal mania was at its height, Parliament required all bills for new canals, river improvements or extensions to existing canals to be accompanied by a map showing the intended works, and a copy of that plan also had to be deposited with the county clerk of the peace. From 1807 these had to be produced on a scale of at least four inches to the mile. These are now held at the Record Office for Leicestershire, Leicester and Rutland. The record office also holds a slightly earlier plan, surveyed in 1792, for the construction of a canal from Grantham to the Trent. This shows parish and county boundaries, distinguishes between turnpike roads, open roads and roads with fences, and also indicates whether the land on each side of the proposed works was open fields or enclosed. This is especially valuable as it coincides with the enclosure of the open fields in several villages along the proposed route. At Barkestone and Plungar, for example, the plan shows both enclosed land (perhaps enclosed for many years) and an area marked ‘new enclosures’, which are not marked out. The Enclosure Act for these parishes was passed in 1791, but the award was not made until 1796, so in 1792 the ‘new enclosures’ were still open fields where the new allotments had yet to be agreed. Without this map it could be impossible to distinguish between the enclosures of 1796 and those that were already in place before then.
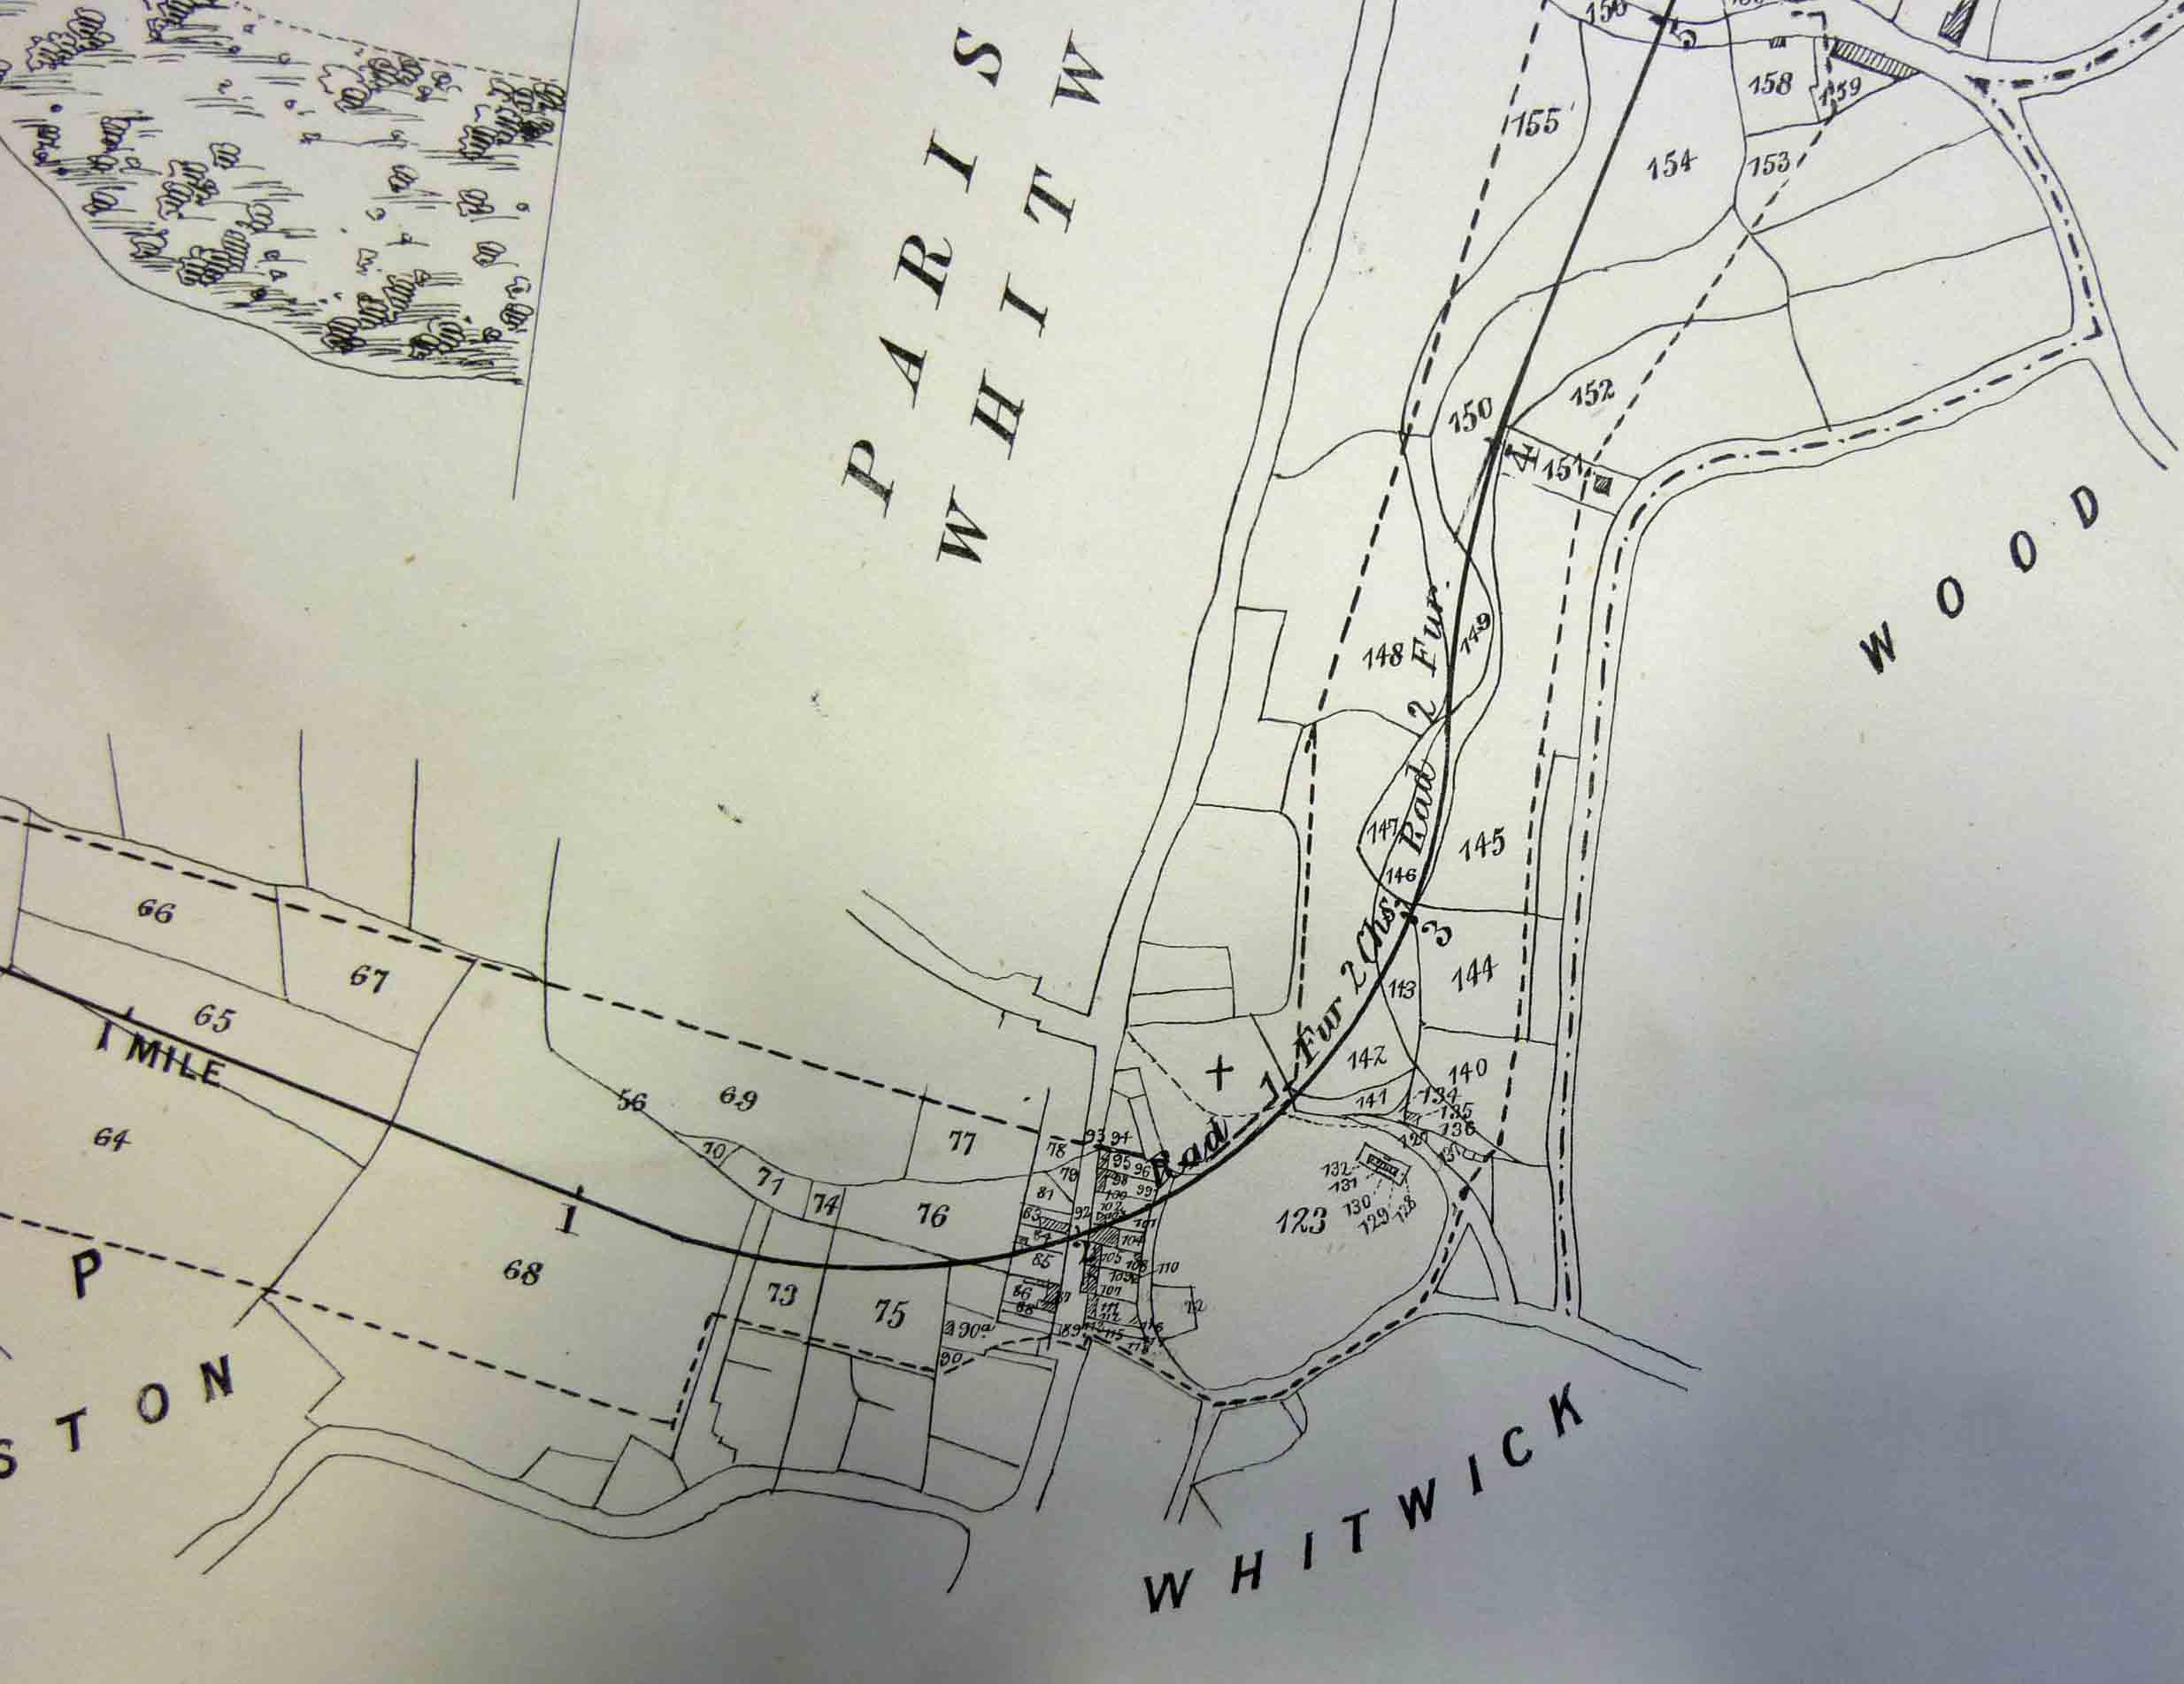
This legislation covered all intended new works, and therefore applied to all proposed railways. Canal and railway plans, like turnpike plans, tend to be linear and show the route including details of the land they pass through. Unlike turnpikes, which mostly took over existing roads, the canals and railways created new communication routes through privately-owned land, and involved negotiations with landowners. The plans therefore had to provide an accurate survey of the land, and often include details of land owners and land use, to facilitate the agreement of a purchase price. Canal and railway plans should be compared to later maps, as not every planned route was actually built. Those which were never built are in some respects the most interesting for the story that can be uncovered, and in some cases the proposal may now be completely forgotten.

For smaller-scale mapping to identify routes, other sources include county maps and Bradshaw’s Railway Guide (from 1830).
Town plans
John Speed’s county map of 1611 included a map of the county town as an inset in one corner. Partly a plan and partly a pictorial representation, buildings are shown in elevation, but as with estate maps of the 17th and 18th centuries which also depict their buildings in this way, other than for the most important buildings, which are mostly named, his drawings may not always be an exact representation of the actual properties. It was not quite the first map of the town. The borough records, held at the Record Office for Leicestershire, Leicester and Rutland, include a plan thought to have been made in about 1610, which shows more of the town walls than appear in Speed’s map. This seems rather curious, as so much wall is unlikely to have disappeared in a year, but other features included in the borough plan suggest it cannot have been much earlier. It just shows that we can never be exactly sure of the date of any survey unless it is clearly recorded (perhaps this was an updated copy of an earlier plan), nor can we know the degree of artistic licence in early representations. Interestingly, the first plan also includes two roads labelled ‘decayed streete’ in the north of the town, but we perhaps should not assume that they were ‘decayed’ in 1610. Other notable plans of Leicestershire were produced by William Stukeley (1722), Thomas Roberts (1741) and a large-scale plan by John Prior/Joseph Whyman within a corner of their county map (1777). The latter does not include building elevations, and the only named properties are the five town churches, the castle, exchange, assembly rooms and, right on the edge of the map, the new infirmary built in 1771. The borough was also mapped in 1832 for the Reform Bill Commissioners, and will in due course be available online as part of the History of Parliament series of books and articles.
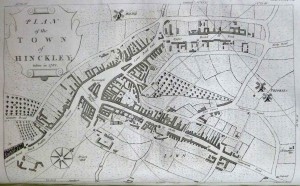
In his maps of other counties, Speed sometimes included the plans of two, three or four towns, but as Leicestershire’s other towns were small they did not attract his attention, or indeed that of other early surveyors or mapmakers. Plans of Loughborough (1735), Melton Mowbray (1787) and part of Market Harborough (1839) are included within estate maps held at the Record Office for Leicestershire, Leicester and Rutland. A plan of Hinckley surveyed by J Robinson in 1782 appears in J. Nichols, History and Antiquities of the County of Leicester, vol. IV. Enclosure or tithe maps can also include the area of a town, for example there is an 1853 tithe map of Lutterworth which includes the whole of the town area.
Like estate maps, town maps can be held in many different repositories, or within the town itself. A catalogue of all town maps known to the authors, R.J.P. Kain and R.R. Oliver, is now available online. It includes 58 ‘town’ maps for Leicestershire, many of Leicester itself, but also including other places, some of which might not be considered ‘towns’ today. There is a full search facility and the details for each map include the date, type (enclosure, tithe, etc.), scale and where a copy can be found (including the reference if held at a record office). The link to ‘area covered by the map’ does exactly what it says, outlining the area that is included on a base map of the vicinity. The actual maps themselves are not available online.